Feel the Force: Fusing GEDI with Satellite Data – a Significant Advance in Measuring Biomass and Carbon Sequestration
Dr Yuri Shendryk gets behind the technical complexity of biomass mapping to tell a compelling story of Dendra System’s solution to a problem that has serious implications.
Forests and other ecosystems such as grasslands and shrublands play a critical role in removing carbon dioxide from the atmosphere and storing it as biomass. Every year, forests alone absorb up to 7.6 billion tonnes of carbon dioxide – that’s as much as one-quarter of the CO2 released from burning fossil fuels and cement production.
So as part of the global community’s efforts to protect and restore forests and other carbon sinks it’s vital that we have an accurate picture of what’s happening on the ground over time. We need to know how much carbon is being sequestered, monitor the changes, and better understand sustainable forest restoration and management.
A question of trust
The problem is that, to date, the measurement of an area of land’s biomass has suffered from a significant lack of accuracy. This in turn leads to uncertainty about the amount of carbon that’s sequestered there, how well or badly that carbon sink is performing year on year, and therefore what actions should be taken. It’s an acute problem, not least for the carbon markets where a project’s claimed biomass and sequestration levels can suffer from a lack of credibility and a consequent distrust of reported results and/or carbon credits generated.
There are many existing approaches to quantification, but the ones commonly adopted by governments around the world rely on computer models with no requirement for either remote sensing or ground measurements. However, the models use inputted assumptions and can only make a best guess about what’s actually happening in reality based on the data they were calibrated against. So if there’s poor calibration or flawed use of a model, contrary to what it might tell you, a land area may be sequestering far less carbon than predicted or even have no forest cover at all. The consequence may be bad decision-making at the project level – as well as higher up at regulatory and policy levels. And in the carbon market it can lead to damaged reputations, depressed credit prices and dampened investment for much-needed carbon mitigation.
Dendra’s approach
The good news is that there is now an alternative methodological approach that provides much greater accuracy and reliability, and Dendra Systems have been at its forefront. It’s an approach that’s been driven by the abundance and free availability of imagery that is space-borne and open access (i.e. non-proprietary). The story starts over 400 kilometers above the Earth’s surface on board the International Space Station. Here, NASA has installed an advanced laser scanning system called Global Ecosystem Dynamics Investigation (GEDI). GEDI uses laser sensors to observe the Earth’s forests and topography, and to assess how deforestation is contributing to atmospheric CO2 concentrations. The sensors can measure biomass almost globally other than at the planet’s poles.
However, GEDI is a sampling tool not a ‘wall-to-wall’ mapping system so even after a full annual cycle of surveying there are still significant gaps in the data. Our solution has been to fill in the gaps by using machine learning that’s trained on millions of GEDI measurements. We combine that with open access Earth Observation data provided by the European Space Agency (ESA) and Copernicus Program from four satellite-based sources (Figure 1):
- Sentinel-1 uses radar imaging to analyze terrain structure including the presence or absence of forest cover. One of its strengths is it can operate day or night irrespective of environmental and weather conditions such as clouds.
- Sentinel-2 captures multi-spectral imagery to provide insights into ecosystem phenology – in this case the influences of season and climate on biomass life cycles.
- GLO-30 Digital Elevation Model (DEM) provides data on the elevation and topography of our planet’s terrain.
- WorldCover delivers information on land cover, differentiating between terrains such as grassland, wetland, snow and ice, built environment, and of course tree cover.
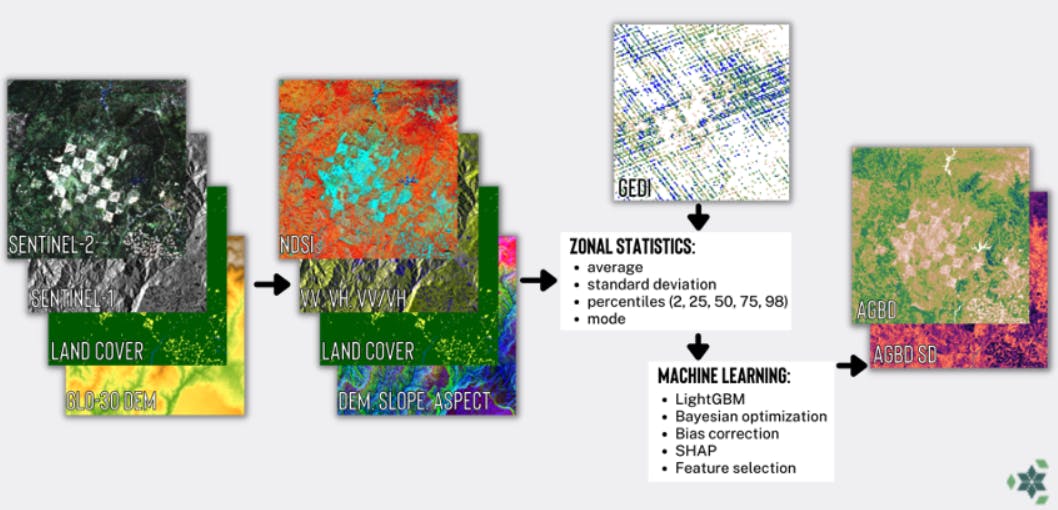
Figure 1: Workflow for the prediction and mapping of the above ground biomass (AGB) and its uncertainty.
Valid, accurate, transparent
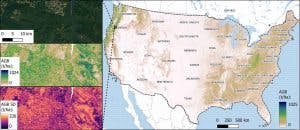
So far we have used this technique to map the biomass of both Australia and the United States (Figure 2). Whilst the methodology can’t analyze every square meter of the land mass being measured (it still has to aggregate data and use averages to extrapolate a full wall-to-wall picture of biomass and hence carbon sequestration), nevertheless it’s a major advance in the evolution of mapping. The result is a huge and highly informative data set at a resolution of 100m.
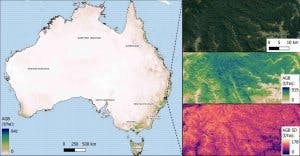
Figure 2: Prediction maps of AGB (t/ha) at 100m resolution across Australia and the United States in 2020. Zoom-in areas show a satellite image, AGB and its uncertainty (±1 standard deviation (SD)).
In essence, the data provide two outputs: a measurement of above ground biomass (AGB), and a measurement of uncertainty i.e. how trustworthy the measurements are. The latter of course is also crucial so in order to validate and compare the accuracy of our methodology we employed two different approaches:
- We compared our US measurements to a biomass map created by the ESA’s Climate Change Initiative (CCI). For the ‘ground truth’ we used a dataset from the Forest Inventory and Analysis (FIA) Program of the US Forest Service. The FIA database is open-access and provides thousands of field measured biomass plots across the United States.
- We also performed a hold-out accuracy assessment of both our US and Australian biomass maps. This involved using 80% of the GEDI dataset to ‘train’ our model and then using the remaining 20% of the GEDI measurements for validation to see how well the model was performing.
So what did we learn? Well, we’re delighted to say we found that Dendra’s methodology is more accurate as it outperforms the CCI map across all accuracy metrics, especially in forests where biomass density is relatively high (greater than 300 tonnes per hectare). So given that our models saturate less in high biomass areas they have the potential to map high biomass tropical forests more accurately than existing techniques. And unlike other models, our framework doesn’t rely on proprietary data that currently must be paid for – it’s all open access which means it’s transparent and anyone can check it.
This of course has important implications. Dendra’s methodology could be used to generate annual wall-to-wall maps of AGB density (and potentially biodiversity indicators) in other regions and possibly globally. That means it could be a valuable resource for multiple stakeholders involved in carbon budgeting and in ecosystem preservation, restoration and sustainable management. In the carbon markets it would enable project developers to make more accurate assessments of carbon sequestration. And it would allow governments, regulators and credit buyers to trust that what should be happening on the ground really is happening.
Dendra’s methodology was presented at the EGU General Assembly and Living Planet Symposium conferences earlier this year.