Remote Sensing and GIS for Ecosystem Restoration
With a global average temperature of 1.1°C above estimated pre-industrial levels, the global community is far off track to meet either the 1.5 or 2°C targets set in the Paris Agreement¹. The main cause of global warming: the continuously increasing releases of anthropogenic carbon dioxide into the atmosphere.
It is estimated that the existing land ecosystems mitigate ~30% of anthropogenic carbon emissions². Whilst the rate of land degradation has decreased in the last decade, the deforestation rate for the last 10 years was still estimated to be 10 million hectares per year³, reducing the ability of our ecosystems to keep absorbing carbon at the same rate. If we don’t halt land degradation, it could lead to increased levels of carbon in the atmosphere and therefore contribute to the increase of global average temperatures. With elevated temperatures comes irreparable challenges; hard temperature limits are also affecting our ecosystems, making it unclear whether they will be able to regulate the same levels of carbon uptake in the near future.
We can’t simply rely on the existing natural ecosystems to sustain livelihoods and mitigate climate change, we need to also restore ecosystems to increase the rate of carbon sequestration. According to “The global tree restoration potential”, there is room for an extra 0.9 billion hectares of canopy cover, which could store 205 gigatonnes of carbon in areas that would naturally support woodlands and forests, reducing a considerable proportion of the global anthropogenic atmospheric carbon burden to date. However, climate change will alter this potential tree coverage, and it’s estimated that if we cannot deviate from the current trajectory, the global potential canopy cover may shrink by ~223 million hectares by 2050, with the vast majority of losses occurring in the tropics4.
The rate of land degradation today is still higher than the rate of land restoration. While there is the potential of climate change mitigation through global tree restoration, there is an urgent need for action. Rehabilitating 12 million hectares of degraded land per year could help close the emissions gap by up to 25% by 20305.
Given the accelerated action required at scale, land managers, policymakers, and other stakeholders need the best available data to understand, plan and manage ecosystem restoration and accurately calculate the carbon sequestration of these ecosystems.
Why remote sensors?
A powerful and scalable way to generate the data to understand, manage and monitor ecosystem restoration is through remote sensing methods. Remote sensing obtains information by utilizing electromagnetic radiation reflected or emitted from the Earth’s surface and the atmosphere. The explicit use of remote sensing in assessing vegetation phenology (study of periodic events in the life cycle of plants in relation to the environment) has been undertaken for many years6. The estimation of vegetation biomass using remote sensing instruments is important because around 50% of the biomass by weight is carbon, and biomass estimates can form the basis of model inputs essential in understanding the carbon cycle7. Conventionally, biomass is estimated using manual field surveys, and although these methods are direct, they involve destructive sampling, are time-consuming and are spatially and temporally restrictive8. Biomass can either be estimated by empirical methods9 or, in some cases, modeling approaches are used based on the interaction between the forest structure and electromagnetic radiation10.
Whilst the estimation of biomass is crucial in determining the carbon content and carbon storage in a forest ecosystem, it is useful to estimate the carbon content of the vegetation by reference to more easily measurable biophysical and structural variables. And using multispectral imaging – we estimate indices like NDVI, which can be used to model LAI (leaf area index), a key biophysical variable.
Remote sensing techniques have been shown to be useful in monitoring forest change for more than three decades, and multi-temporal assessment of forests facilitates monitoring of subtle or major changes in forests over a period of time and within different types of forest stands11.
Before we start reviewing some of the most common types of remote sensing methods currently used to capture data that can help generate ecosystem restoration insights, let’s get some of the basics about resolution.
Resolution plays a key role in how data from a sensor can be used. The resolution of an image refers to the potential detail provided by the imagery. There are four types of resolution to consider for any dataset: spatial, spectral, radiometric and temporal.
Spatial Resolution is defined by the size of each pixel within a digital image and the area on Earth’s surface represented by that pixel12. It is usually presented as a single value representing the length of one side of a square, for example, a spatial resolution of 20m means that one pixel displays an area 20 by 20 meters on the ground (a spatial area of 400 square meters). Spatial resolution refers to the size of the smallest feature that can be detected by a remote sensor and displayed in an image. The finer the resolution (the lower the number), the more detail you can see in the image.
Spectral Resolution refers to the ability of a remote sensor to measure specific wavelengths of the electromagnetic spectrum, capturing the number and size of the bands. The narrower the range of wavelengths for a given band, the finer the spectral resolution.
Temporal Resolution refers to the time between images, the frequency at which imagery is recorded for a particular area. For example, the MODIS satellite captures the same area every one to two days, while most Landsat satellites take images of the same area every 16 days 13.
Radiometric Resolution is the amount of information in each pixel to detect slight differences in energy. The higher the radiometric resolution, the more values are available to store information, providing better discrimination between even the slightest differences in energy. For example, when assessing water quality, radiometric resolution is necessary to distinguish between subtle ocean color differences.
Remote sensing methods
Before deep-diving into the remote sensing methods that can generate insightful data, let’s have a brief reminder of some basic physics. A good way to study and identify vegetation and its properties is to understand how light interacts with it. The study of light interaction with matter is called spectroscopy. Spectroscopy examines how light behaves with the target and recognises matter (in this case, vegetation) based on their different spectral signatures. Whenever the light interacts with a specific target, the response varies based on the wavelength of that light. Spectral signatures are the variation of reflectance or absorption of a target with respect to wavelengths. Spectral signatures are like fingerprints that can be used to identify vegetation15. The difference between absorption and reflectance is also used to develop vegetation indices such as NDVI, which can help estimate insights such as vegetation health. Some of these are key variables used for the computation of above-ground biomass and therefore critical to accurately understand the carbon sequestration of certain ecosystems.
Remote sensing data collection methods can be passive or active. Passive methods detect natural energy that is absorbed or reflected by the area being observed, with the common source of radiation detected by passive sensors being sunlight. Active methods use their own source of energy, and the resultant signal that is reflected back is measured.
- Passive Remote sensing methods
Aerial photography: An ordinary camera captures light across three wavebands in the visible spectrum, red, green, and blue (RGB). From imagery captured with ultra-high resolution cameras, it is possible to visualize ecosystems down to individual leaves on trees and blades of grass on the ground and, therefore, identify and quantify species.
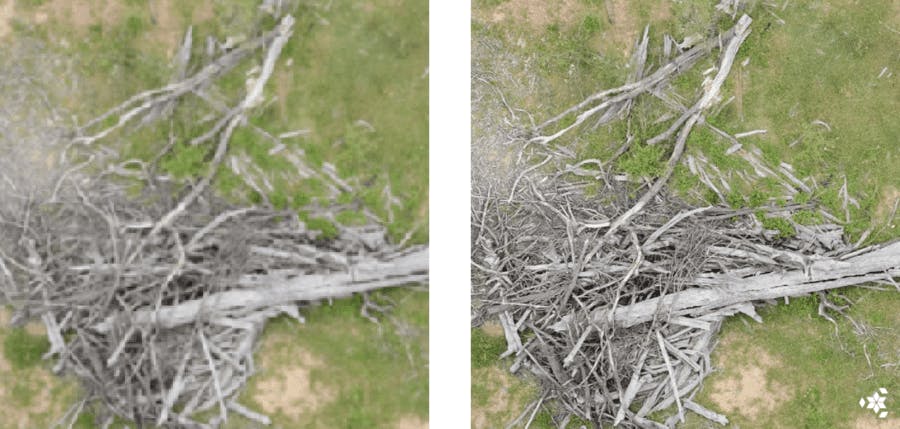
Comparison of RGB standard vs RGB ultra high resolution imagery of the same area.
Spectral imaging: A group of analytical techniques that collect spectroscopic and imaging information using multiple bands across the electromagnetic spectrum. Spectral imaging encompasses a wide variety of methodologies that go beyond RGB, such as the infrared, the visible spectrum, the ultraviolet, x-rays, or a combination of those. This means that it’s possible to capture hundreds of wavelength bands for each pixel in an image. There are 2 main types of spectral imagery:
- Multispectral imagery consists of 3-5 wavebands, collecting information on RGB, Near Infrared Region (NIR) and RedEdge bands. As an example, this is the data collected by Landsat, Sentinel or Rapid eye satellite imagery. This data is to estimate vegetation cover and vegetation health.
- Hyperspectral imagery is collected in very narrow continuous bands across a wide range of wavelengths, enabling more detailed information, including unique spectral signatures that can help detect species. It’s a promising methodology to generate ecosystem insights in areas where other imagery isn’t just enough, such as soil composition. However, it requires more expensive instrumentation and more complex data processing than the simpler imagery techniques.
Thermal imaging: Thermal imaging predominantly uses the long wave infrared region (LWIR) of the electromagnetic spectrum. Their application varies from measuring soil temperature to mineral identification and identifying brush fire hot spots.
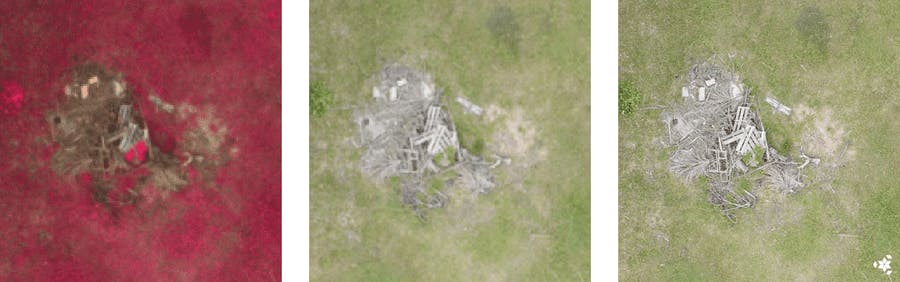
Comparison of multispectral standard vs RGB standard vs RGB ultra high resolution imagery of the same area.
- Active remote sensing methods
LiDAR: Light Detection and Ranging is an active remote sensing technology that serves as its own provider of light by using a laser to transmit a light pulse and a receiver with sensitive detectors to measure the reflected light. Distance to the object is determined by recording the time between the transmitted and reflected pulses and using the speed of light to calculate the distance travelled16. It’s a 3D technology and used to calculate biophysical variables like tree height, diameter at breast height (DBH), canopy cover and LAI.
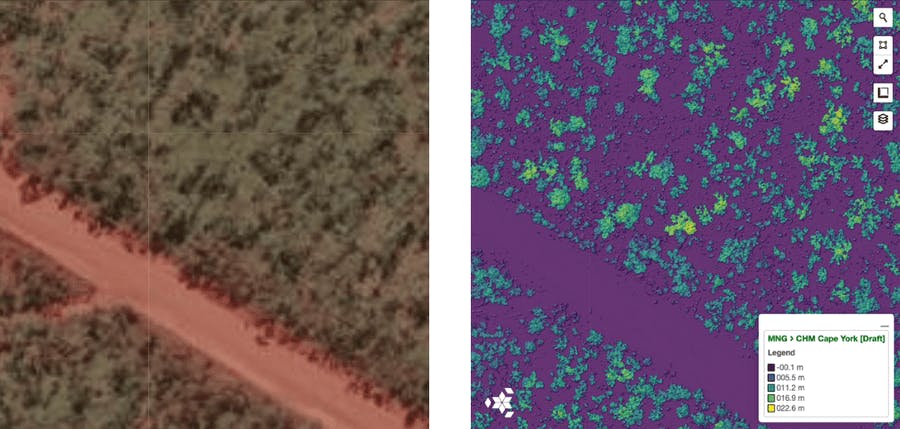
Comparison of standard vs LiDAR imagery of the same area. LiDar model showing Tree Height.
SAR: Synthetic Aperture Radar is a type of active data collection where a sensor that first transmits microwave signals and then records the amount of that energy reflected back after interacting with the target17. Unlike optical technology, synthetic aperture radar (SAR) can “see” through darkness, clouds, and rain, detecting changes in habitat, levels of water and moisture, effects of natural or human disturbance, and changes in the Earth’s surface after events such as earthquakes or sinkhole openings18.
Platforms
Remote sensing utilizes sensors to collect information about a specific area. Passive sensors can be either satellite-based, manned aircrafts or UAV based. The key to any image from these sensors is radiometric, spatial, spectral and temporal resolution and parameters such as coverage. Each type of device has its own advantages and disadvantages. When capturing imagery, it’s important to consider factors like flight restrictions, image resolution and coverage.
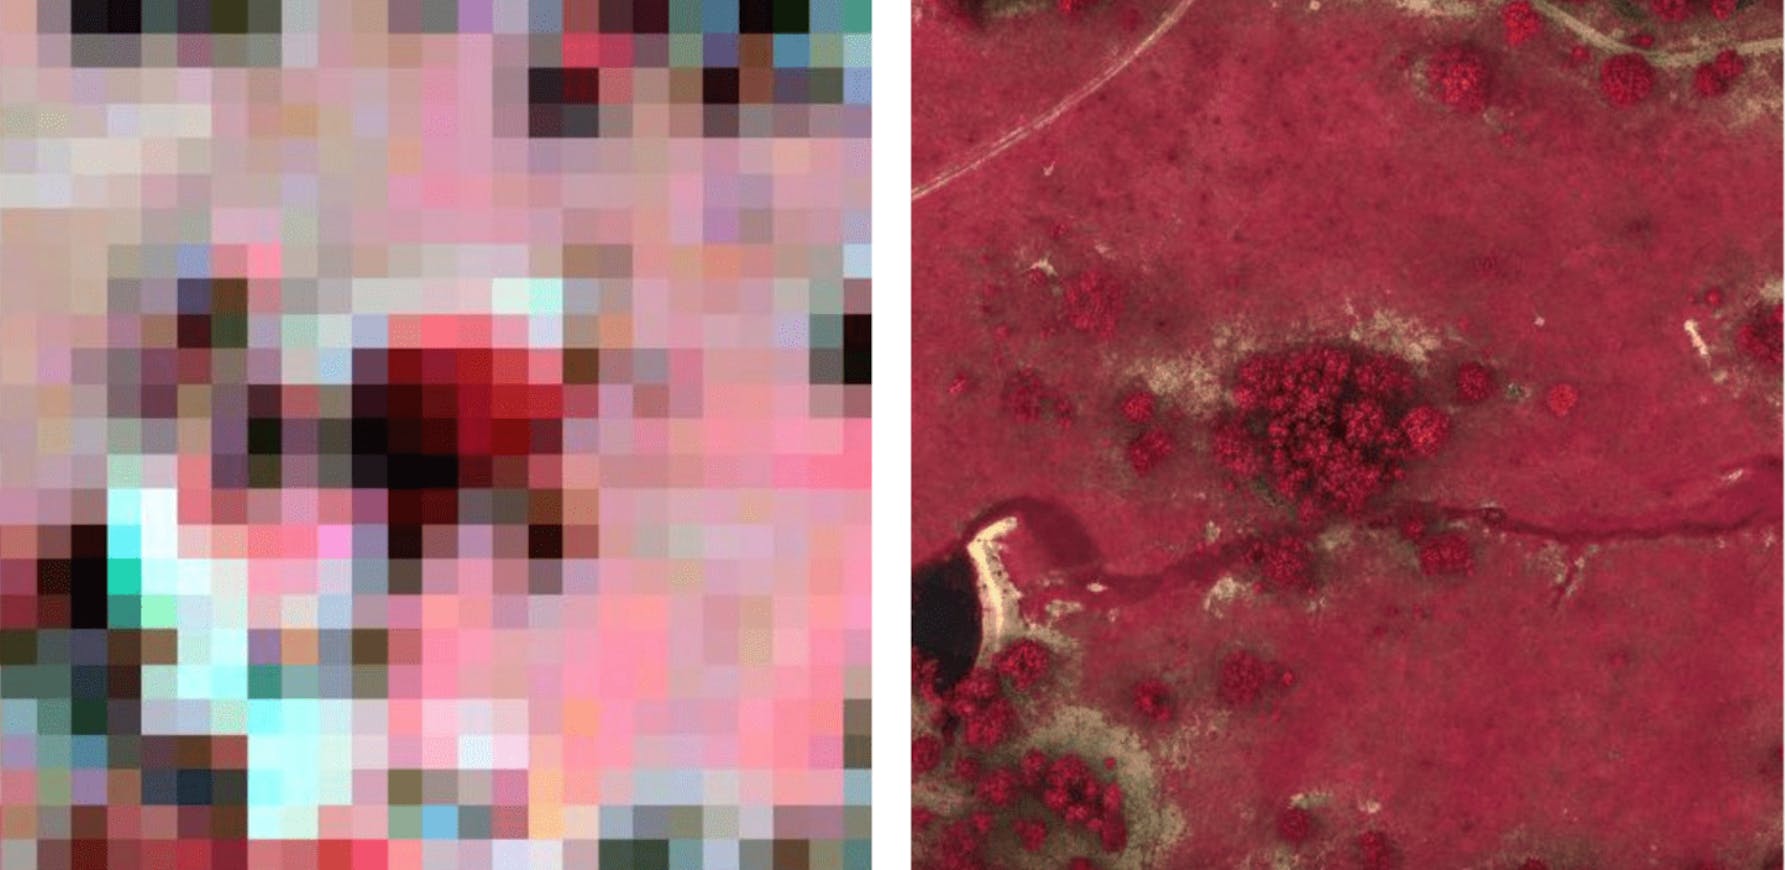
Satellites can provide imagery in RGB, including Near Infrared Reflectance (NIR), Red Edge, short wave infra-red regions (SWIR). They also provide hyperspectral and SAR data. Conventional satellites provide scale, free availability of data, and are constantly circling the Earth, enabling full Earth coverage. They also enable temporal resolution since they can capture imagery of the same area with a specific high frequency. However, the quality of imagery is largely dependent on the cloud cover, which masks the target features. Another challenge is that spatial resolution varies from 10m-60m roughly for free available satellite imagery, which means that the imagery would contain an area of 100 square meters or more, making it difficult to capture detailed data and generate accurate vegetation insights like species identification.
There is also commercial satellite imagery that can be requested on demand, and that has a substantial archive of historical imagery of the same area, also guaranteeing that cloudy areas won’t take more than 10% of the imagery. This satellite imagery has a better spatial resolution of approximately 30cm, enabling more detail and information to recognize certain species or fauna, depending on their size. Let’s look at an example to make it more visual. At 30cm spatial resolution, you could identify a polar bear, but you wouldn’t be able to identify a rabbit. A rabbit is around 30cm, which means that if we were looking at an image with 30cm spatial resolution, it would show as a white pixel, impossible to recognize. Ideally, each species should take approximately 32×32 pixels to be able to identify it19. To reliably detect and identify targets which are less than 30cm resolution, you’d need an imagery with resolution of <1cm. The bottom line is this, the choice of spatial and spectral resolution depends on the target that needs to be identified
Whilst there are many advantages to satellite imagery such as extensive coverage, frequency and historical data, the spatial resolution that these sensors can capture can help monitor ecosystem changes at a high level but can’t provide the detail and accuracy of data required to restore them.
Manned aircrafts can also provide RGB, multi spectral data, hyper spectral data and SAR as well as LiDAR, which enables more accurate and detailed imagery. Manned aircrafts’ resolution is much higher than satellites and comparable to that achievable from some UAVs or drones. However these aircrafts are restricted to the height at which the aircraft is flying and the pixel resolution varies according to the flight height. There are many advantages to these platforms such as scalability, the fact that they fly below clouds and therefore provide cloud-free imagery, the capability to cover areas that satellites can’t due to their orbital paths and the flexibility to choose when the data is captured. In this case the rabbit would be taking 6 pixels so it would still be difficult to recognize but we could start identifying other fauna such as horses. These platforms are much more expensive and also have higher risks during flight operations.
Drones or UAVs can also capture RGB, multispectral data, hyperspectral data as well as thermal and LiDAR. The biggest advantage of drones compared to the other types of devices is the resolution, being able to capture ultra high resolution, less than 2cm spatial resolution. Multirotor drones don’t have a minimum fly speed, they can be stationary, and they can fly lower than aircrafts safely. The combination of flying closer to the ground and as slow as required enables the capability of having focused high-resolution imagery. Some manned aircrafts could also enable the same resolution, but because of the ground speed, no camera could take a picture fast enough for the results not to come up blurry, and there is no use for high-resolution imagery that is not focused. Drones are also easier to deploy on demand, faster to activate and timing is key to capture certain events such as when species are flowering. Individual drones cover smaller areas, but by utilizing new swarm technology multiple drones can easily scale to cover vast areas.
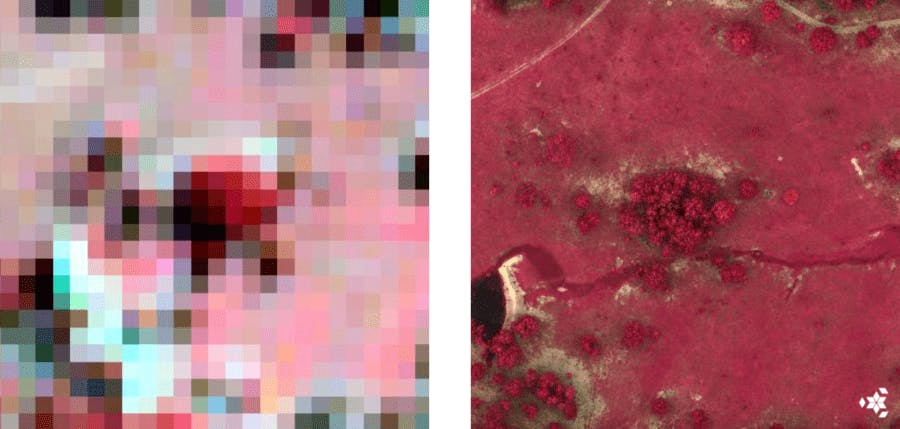
Comparison of multispectral image of the same area taken from satellite vs UAV.
Protecting and conserving ecosystems requires data that can prove areas are still standing, aren’t under attack and are healthy, something achievable with satellite data. However, restoring ecosystems from scratch requires data that can uncover the details of biodiversity, soil erosion, weed species, native species, feral animals and many more insights that can’t be produced with satellite imagery. Whilst with satellite imagery, it is possible to identify mature trees (e.g. 10-year-old trees), it’s not possible to detect the smaller and younger trees and individual plants at the species level, who are more fragile and, as such, will need closer monitoring to ensure survival. To understand biodiversity and ecosystem complexity, we need the high-resolution imagery and data currently enabled by drones. We also need to use GIS systems as a technology to drive analytics and generate insights from remote sensing data and visualise it. It is critical to understand the purpose of capturing data and the variables that need to be taken into consideration to determine what remote sensing method and platform is required and more suitable in different scenarios. It’s also about innovating to figure out the best combination of methodologies to create the optimal solution for the different challenges that we currently face.
References
1. SDG website: https://sdgs.un.org/goals/goal13 2. How close are we to the temperature tipping point of the terrestrial biosphere?, Katharyn A. Duffy, Christopher R. Schwalm, Vickery L. Arcus, George W. Koch, Liyin L. Liang and Louis A. Schipper, (2021), Link: https://advances.sciencemag.org/content/7/3/eaay1052 3. Deforestation has slowed down but still remains a concern, new UN report reveals, UN, (2020), Link: https://news.un.org/en/story/2020/07/1068761#:~:text=The%20annual%20rate%20of%20deforestation,million%20more%20than%20in%201990 4. The global tree restoration potential, Jean-Francois Bastin, Yelena Finegold, Claude Garcia, Danilo Mollicone, Marcelo Rezende, Devin Routh, Constantin M. Zohner, Thomas W. Crowther, (2019), Link: https://science.sciencemag.org/content/365/6448/76.abstract 5. 10 years to boost ecosystem restoration for people and planet, UNEP (2020), Link: https://www.unep-wcmc.org/news/10-years-to-boost-ecosystem-restoration-for-people-and-planet 6. Ashley et al., 1973 7. Bortolot and Wynne, 2005 8. Garcia et al., 2010 9. Steininger, 2000 10. Strahler, 1997 11. Boyd and Danson, 2005 12. What is remote sensing, EarthData, NASA, Link: https://earthdata.nasa.gov/learn/backgrounders/remote-sensing 13. What is remote sensing, EarthData, NASA, Link: https://earthdata.nasa.gov/learn/backgrounders/remote-sensing 14. What is remote sensing, EarthData, NASA, Link: https://earthdata.nasa.gov/learn/backgrounders/remote-sensing 16. What is hyperspectral imaging - Updated Tutorial, SpecimSpectral, (2019), Link:https://www.youtube.com/watch?v=ayp7hP0Xr8Q 16. Remote Sensing Methods, Nasa Earth Observatory, Link: https://earthobservatory.nasa.gov/features/RemoteSensing/remote_08.php 17. What is Synthetic Aperture Radar, Earth Data, NASA, Link: https://earthdata.nasa.gov/learn/backgrounders/what-is-sar 18. What is SAR, ASF, Link: https://asf.alaska.edu/information/sar-information/what-is-sar/ 19. https://people.csail.mit.edu/torralba/publications/howmanypixels.pdf